Configuring syslog services on NSX-T components: Difference between revisions
No edit summary |
|||
| (4 intermediate revisions by 2 users not shown) | |||
| Line 1: | Line 1: | ||
There is a lot of confusion going on, on how to configure logging on the NSX-T Manager components. | There is a lot of confusion going on, on how to configure logging on the NSX-T Manager components. | ||
I get questions like: | I get questions like: | ||
| Line 19: | Line 14: | ||
In this article, we will try to answer all of these questions with examples. | In this article, we will try to answer all of these questions with examples. | ||
=Topology= | ==Topology== | ||
Below you will find the topology we are testing with. | Below you will find the topology we are testing with. | ||
| Line 26: | Line 21: | ||
We have used a vRealize Log Insight Server that is not displayed on the drawing to sent our log messages to. | We have used a vRealize Log Insight Server that is not displayed on the drawing to sent our log messages to. | ||
=Enable logging on the NSX | ==Enable logging on the NSX–T Manager== | ||
Before we start we first want to get something out of this world. | Before we start we first want to get something out of this world. | ||
When you configure the required Syslog commands on the NSX-T Manager the Manager will NOT push the logging servers to the Edge Transport Nodes or on the Transport Nodes. | When you configure the required Syslog commands on the NSX-T Manager the Manager will NOT push the logging servers to the Edge Transport Nodes or on the Transport Nodes. | ||
| Line 59: | Line 54: | ||
You can find out more on the about message-id's types [https://docs.vmware.com/en/VMware-NSX-T-Data-Center/2.4/administration/GUID-CC18C0E3-D076-41AA-8B8C-133650FDC2E7.html here] | You can find out more on the about message-id's types [https://docs.vmware.com/en/VMware-NSX-T-Data-Center/2.4/administration/GUID-CC18C0E3-D076-41AA-8B8C-133650FDC2E7.html here] | ||
=Enable logging on the Edge Transport Nodes | ==Enable logging on the Edge Transport Nodes 〈Edge VMs〉== | ||
In order to receive logging messages from our T0 and T1 Gateways, we also need to enable logging on the Edge Transport Nodes. | In order to receive logging messages from our T0 and T1 Gateways, we also need to enable logging on the Edge Transport Nodes. | ||
| Line 150: | Line 145: | ||
The SOURCE of this logging message is the Edge VM itself where the log message is initiated from. | The SOURCE of this logging message is the Edge VM itself where the log message is initiated from. | ||
=Enable logging on the Host Transport Nodes | ==Enable logging on the Host Transport Nodes 〈ESXi Hosts〉== | ||
In order to log Distributed Firewall Rules (DFW) you need to enable commands on the Host Transport nodes (ESXi hosts) itself. | In order to log Distributed Firewall Rules (DFW) you need to enable commands on the Host Transport nodes (ESXi hosts) itself. | ||
You don't need any logging configuration on the NSX-T Manager and we tested this by removing the commands on the manager: | You don't need any logging configuration on the NSX-T Manager and we tested this by removing the commands on the manager: | ||
| Line 215: | Line 210: | ||
And the logging messages appear nicely in our logging server | And the logging messages appear nicely in our logging server | ||
<span style="border:3px solid #f4c613;display: inline-block;">[[File:logging-nsxt-210620019-09.png| | <span style="border:3px solid #f4c613;display: inline-block;">[[File:logging-nsxt-210620019-09.png|400]]</span> | ||
The SOURCE of this logging message is the Transport Node itself where the log message is initiated from. | The SOURCE of this logging message is the Transport Node itself where the log message is initiated from. | ||
| Line 251: | Line 246: | ||
<span style="border:3px solid #f4c613;display: inline-block;">[[File:logging-nsxt-210620019-12.png|800px]]</span> | <span style="border:3px solid #f4c613;display: inline-block;">[[File:logging-nsxt-210620019-12.png|800px]]</span> | ||
I am always trying to improve the quality of my articles so if you see any errors, mistakes in this article or you have suggestions for improvement, [[Special:Contact|please contact me]] and I will fix this. | |||
''' | '''This wiki article was written by [https://www.linkedin.com/in/iwanhoogendoorn/ Iwan Hoogendoorn]''' | ||
'''The outputs and tests were done by [https://www.linkedin.com/in/iwanhoogendoorn/ Iwan Hoogendoorn] and [https://www.linkedin.com/in/sergueiichtchenko/ Sergei Ischenko ]''' | |||
[[Category: NSX]] | [[Category: NSX]] | ||
[[Category:Networking]] | [[Category:Networking]] | ||
[[Category:VMware]] | [[Category:VMware]] | ||
Latest revision as of 19:18, 16 March 2024
There is a lot of confusion going on, on how to configure logging on the NSX-T Manager components. I get questions like:
1) How do we log the Distributed Firewall rules?
2) What is the source of the logging messages?
3) How do I see logging for the T0 or T1 Gateways and Gateway firewalls?
4) Is it possible to configure separate logging servers for different purposes?
5) Is it possible to log the Distributed Firewall rules to a separate logging server?
In this article, we will try to answer all of these questions with examples.
Topology
Below you will find the topology we are testing with.
We have used a vRealize Log Insight Server that is not displayed on the drawing to sent our log messages to.
Enable logging on the NSX–T Manager
Before we start we first want to get something out of this world. When you configure the required Syslog commands on the NSX-T Manager the Manager will NOT push the logging servers to the Edge Transport Nodes or on the Transport Nodes. When we configure logging on the manager this will only provide information on what is happening on the manager.
When you have a manager cluster you set up an SSH session to the VIP and you put in these commands:
nsxapp-01a> set logging-server 192.168.110.24 proto udp level info
WARNING - You are configuring udp-based log forwarding. This will send sensitive information unencrypted over the network. The Splunk App for NSX-T only accepts TLS connections.
nsxapp-01a> get logging-servers
192.168.110.24 proto udp level info
When we have put in these commands we can see the following messages showed up in the Logging Server:
The SOURCE of this logging messages is the NSX-T Manager itself where the log message is initiated from.
It is also possible to send a certain type of messages to the logging server and this is done by configuring a "messageid".
nsxapp-01a> set logging-server 192.168.110.24 proto udp level info messageid FIREWALL,FIREWALL-PKTLOG
WARNING - You are configuring udp-based log forwarding. This will send sensitive information unencrypted over the network. The Splunk App for NSX-T only accepts TLS connections.
This will only send out a specific type of logging messages to a specific logging server. You can find out more on the about message-id's types here
Enable logging on the Edge Transport Nodes 〈Edge VMs〉
In order to receive logging messages from our T0 and T1 Gateways, we also need to enable logging on the Edge Transport Nodes. We want to stress one more time that the logging server is NOT pushed automatically on the Edge Transport Nodes by the manager.
edgenodi-01a> set logging-server 192.168.110.24 proto udp level info
WARNING - You are configuring udp-based log forwarding. This will send sensitive information unencrypted over the network. The Splunk App for NSX-T only accepts TLS connections.
edgenodi-01a> get logging-servers
192.168.110.24 proto udp level info
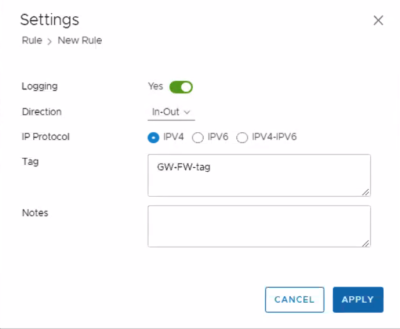
We have enabled the Gateway firewall and configured a rule with a tag + logging enabled for testing purposes.
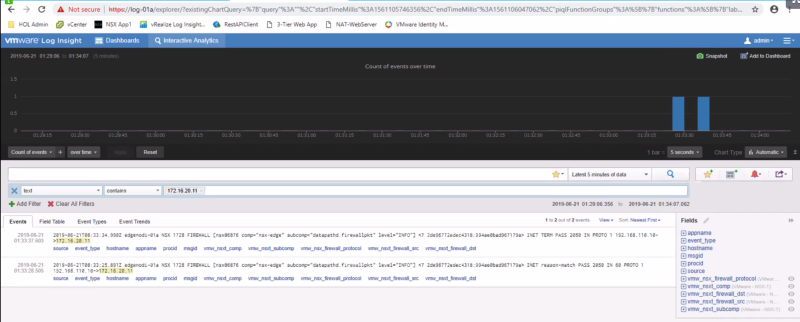
And we did a ping test from the "outside" world into the "NSX" world:
C:\Users\Administrator>ping 172.16.20.11

Pinging 172.16.20.11 with 32 bytes of data:
Reply from 172.16.20.11: bytes=32 time=46ms TTL=61
Reply from 172.16.20.11: bytes=32 time=6ms TTL=61
Reply from 172.16.20.11: bytes=32 time=6ms TTL=61
Reply from 172.16.20.11: bytes=32 time=6ms TTL=61

Ping statistics for 172.16.20.11:
    Packets: Sent = 4, Received = 4, Lost = 0 (0% loss),
Approximate round trip times in milli-seconds:
    Minimum = 6ms, Maximum = 46ms, Average = 16ms

C:\Users\Administrator>
And the logging messages appear nicely in our logging server
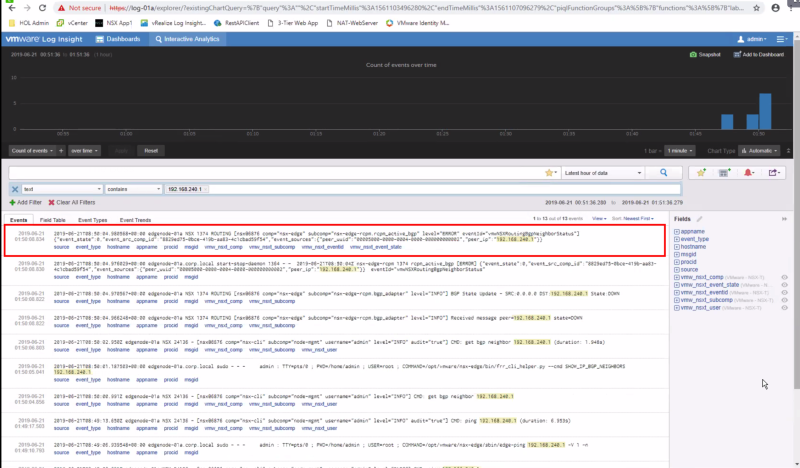
We have also simulated a BGP peer disruption and this also appeared nicely in our logging server:
Here you see the BGP peer is ESTABLISHED:
edgenode-01a(tier0_sr)> get bgp neighbor summary
BFD States: NC - Not configured, AC - Activating,DC - Disconnected
            AD - Admin down, DW - Down, IN - Init,UP - Up
BGP summary information for VRF default for address-family: ipv4Unicast
Router ID: 192.168.240.3  Local AS: 100

Neighbor                            AS          State Up/DownTime  BFD InMsgs  OutMsgs InPfx  OutPfx

192.168.240.1                       200         Estab 18:09:18     NC  3373    3423    12     14
Then we bring it down and test it with ping to see if it is really down:
edgenode-01a(tier0_sr)> ping 192.168.240.1
PING 192.168.240.1 (192.168.240.1): 56 data bytes
^C
edgenode-01a(tier0_sr)>
--- 192.168.240.1 ping statistics ---
8 packets transmitted, 0 packets received, 100.0% packet loss
And we verify again, and see the status is now ACTIVE:
edgenode-01a(tier0_sr)> get bgp neighbor summary
BFD States: NC - Not configured, AC - Activating,DC - Disconnected
            AD - Admin down, DW - Down, IN - Init,UP - Up
BGP summary information for VRF default for address-family: ipv4Unicast
Router ID: 192.168.240.3  Local AS: 100

Neighbor                            AS          State Up/DownTime  BFD InMsgs  OutMsgs InPfx  OutPfx

192.168.240.1                       200         Activ 00:00:26     NC  3373    3427    0      0
And we verify this is the logging server:
The SOURCE of this logging message is the Edge VM itself where the log message is initiated from.
Enable logging on the Host Transport Nodes 〈ESXi Hosts〉
In order to log Distributed Firewall Rules (DFW) you need to enable commands on the Host Transport nodes (ESXi hosts) itself. You don't need any logging configuration on the NSX-T Manager and we tested this by removing the commands on the manager:
nsxapp-01a> del logging-server 192.168.110.24 proto udp level info
nsxapp-01a> get logging-servers
nsxapp-01a>
And we have added the following configuration into the Host Transport nodes:
[root@esxcomp-02a:~] esxcli network firewall ruleset set -r syslog -e true
[root@esxcomp-02a:~] esxcli system syslog config set --loghost=udp://192.168.110.24:514
[root@esxcomp-02a:~] esxcli system syslog reload
[root@esxcomp-02a:~] esxcli system syslog mark -s "This is a test message"
[root@esxcomp-02a:~] esxcli system syslog config get
   Default Network Retry Timeout: 180
   Dropped Log File Rotation Size: 100
   Dropped Log File Rotations: 10
   Enforce SSLCertificates: false
   Local Log Output: /scratch/log
   Local Log Output Is Configured: false
   Local Log Output Is Persistent: true
   Local Logging Default Rotation Size: 1024
   Local Logging Default Rotations: 8
   Log To Unique Subdirectory: false
   Message Queue Drop Mark: 90
   Remote Host: udp://192.168.110.24:514
We have enabled the DFW firewall and configured a rule with a tag + logging enabled for testing purposes.
And we have done another ping test:
C:\Users\Administrator>ping 172.16.20.11

Pinging 172.16.20.11 with 32 bytes of data:
Reply from 172.16.20.11: bytes=32 time=46ms TTL=61
Reply from 172.16.20.11: bytes=32 time=6ms TTL=61
Reply from 172.16.20.11: bytes=32 time=6ms TTL=61
Reply from 172.16.20.11: bytes=32 time=6ms TTL=61

Ping statistics for 172.16.20.11:
    Packets: Sent = 4, Received = 4, Lost = 0 (0% loss),
Approximate round trip times in milli-seconds:
    Minimum = 6ms, Maximum = 46ms, Average = 16ms

C:\Users\Administrator>
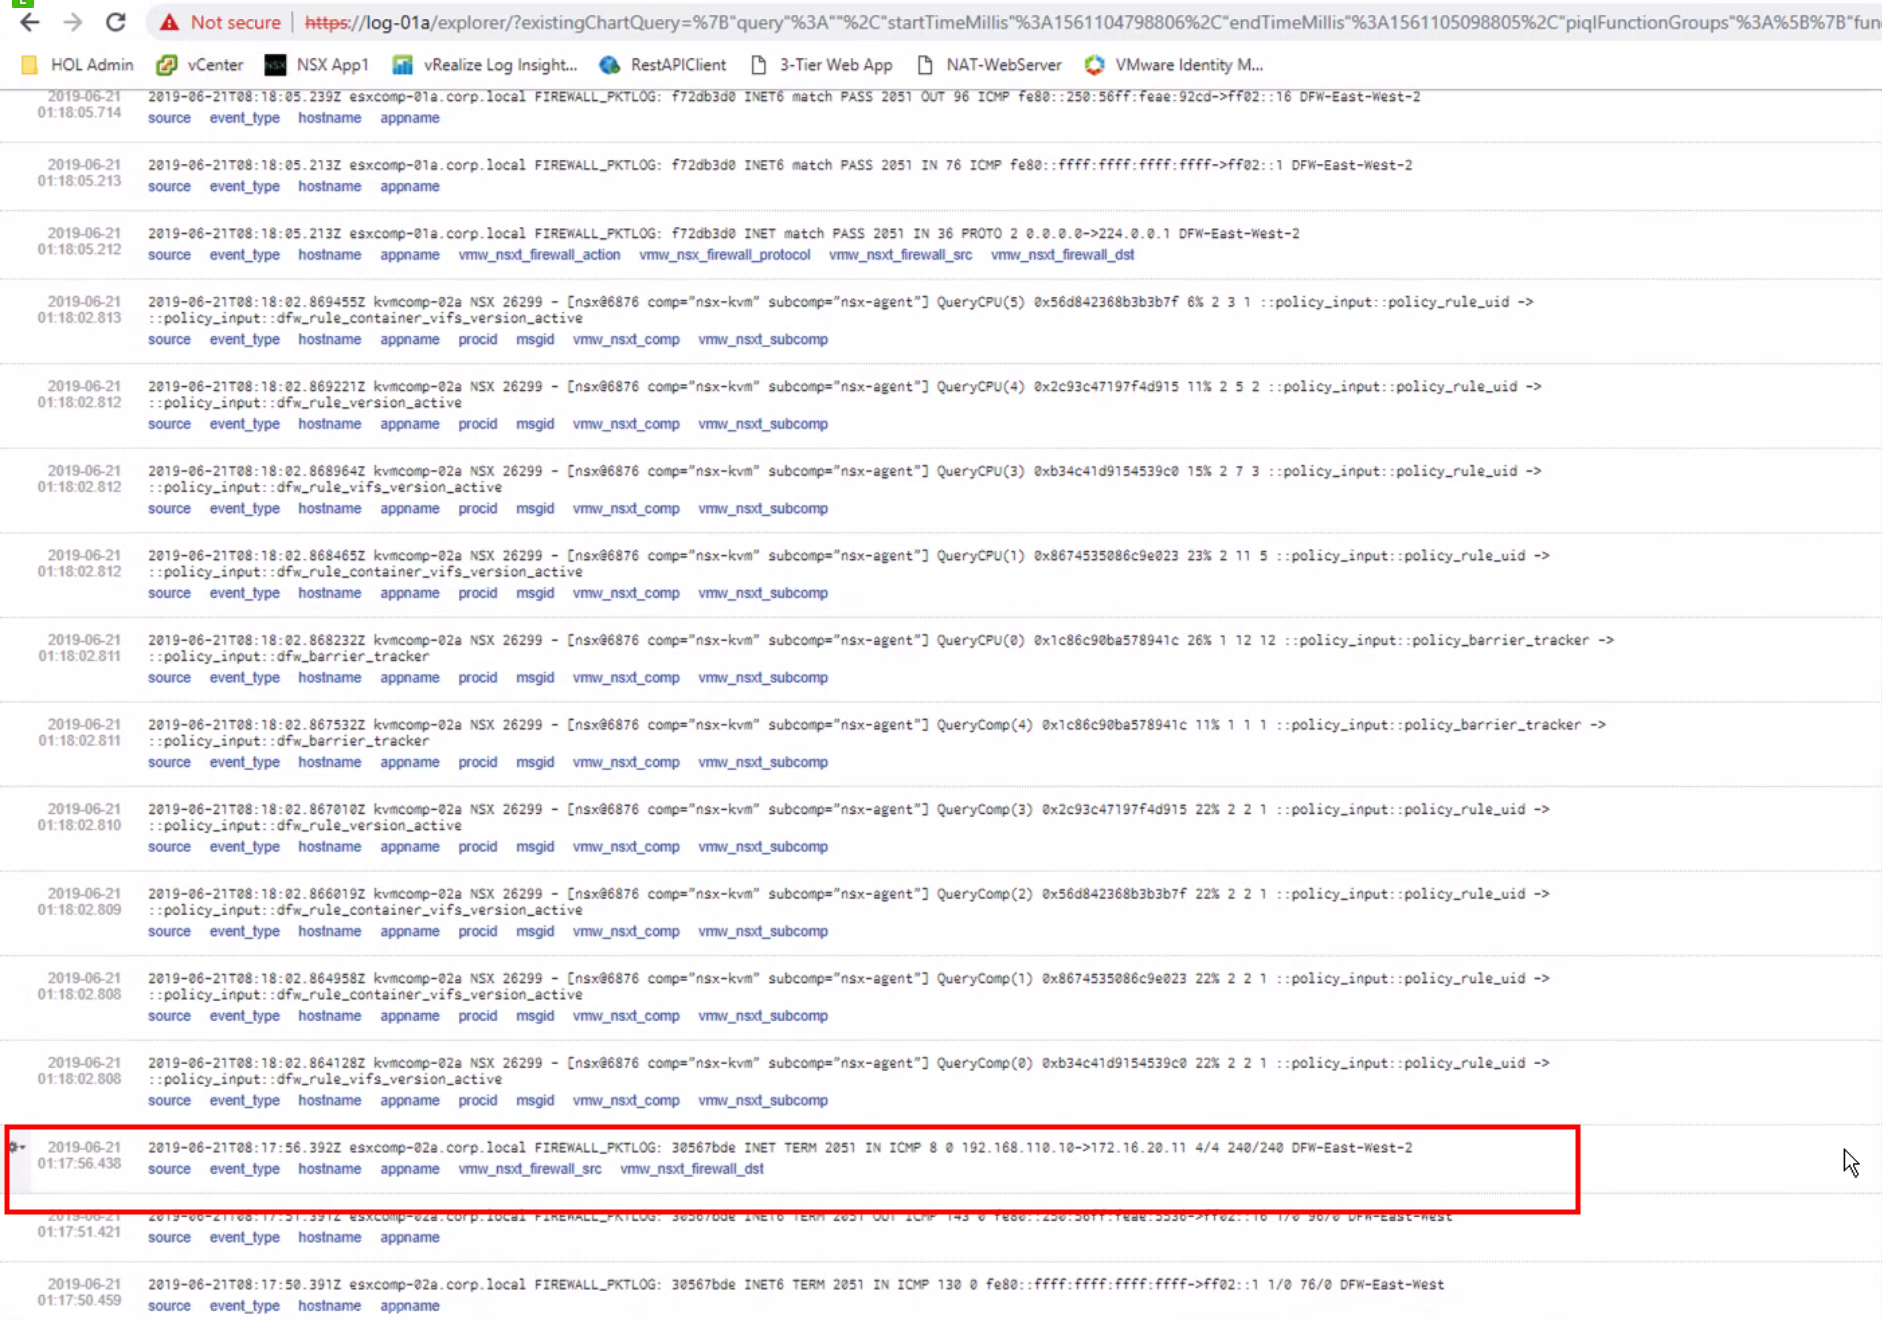
And the logging messages appear nicely in our logging server
The SOURCE of this logging message is the Transport Node itself where the log message is initiated from.
It is NOT possible to send the DFW to a separate logging server and split another type of message and send these to another logging server. If you want this you have two options:
- Configure another (second) logging server on the ESXi host so all messages are sent to two different logging servers
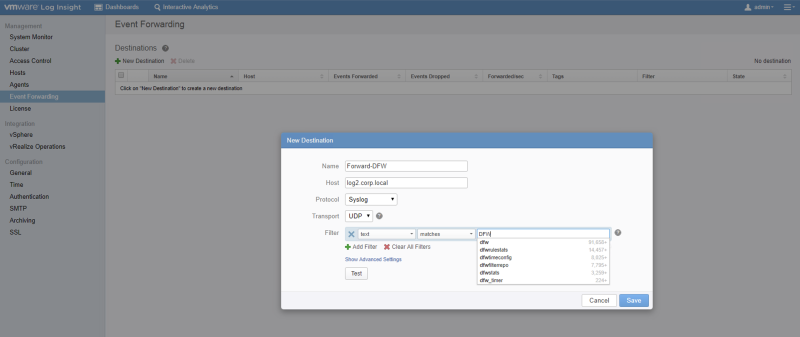
- Use vRealize Log Insight to send all logging messages to and configure a forwarding with a filter to send out certain logging messages.
Below an example is given on how to configure multiple logging servers on the ESXi host:
[root@esxcomp-02a:~] esxcli system syslog config set --loghost=udp://192.168.110.24:514,udp://192.168.110.111:222
[root@esxcomp-02a:~] esxcli system syslog config get
  Default Network Retry Timeout: 180
  Dropped Log File Rotation Size: 100
  Dropped Log File Rotations: 10
  Enforce SSLCertificates: false
  Local Log Output: /scratch/log
  Local Log Output Is Configured: false
  Local Log Output Is Persistent: true
  Local Logging Default Rotation Size: 1024
  Local Logging Default Rotations: 8
  Log To Unique Subdirectory: false
  Message Queue Drop Mark: 90
  Remote Host: udp://192.168.110.24:514,udp://192.168.110.111:222
And if you want to go for option two then you configure the vRealize Log Insight Server with the below settings
I am always trying to improve the quality of my articles so if you see any errors, mistakes in this article or you have suggestions for improvement, please contact me and I will fix this.
This wiki article was written by Iwan Hoogendoorn
The outputs and tests were done by Iwan Hoogendoorn and Sergei Ischenko


